
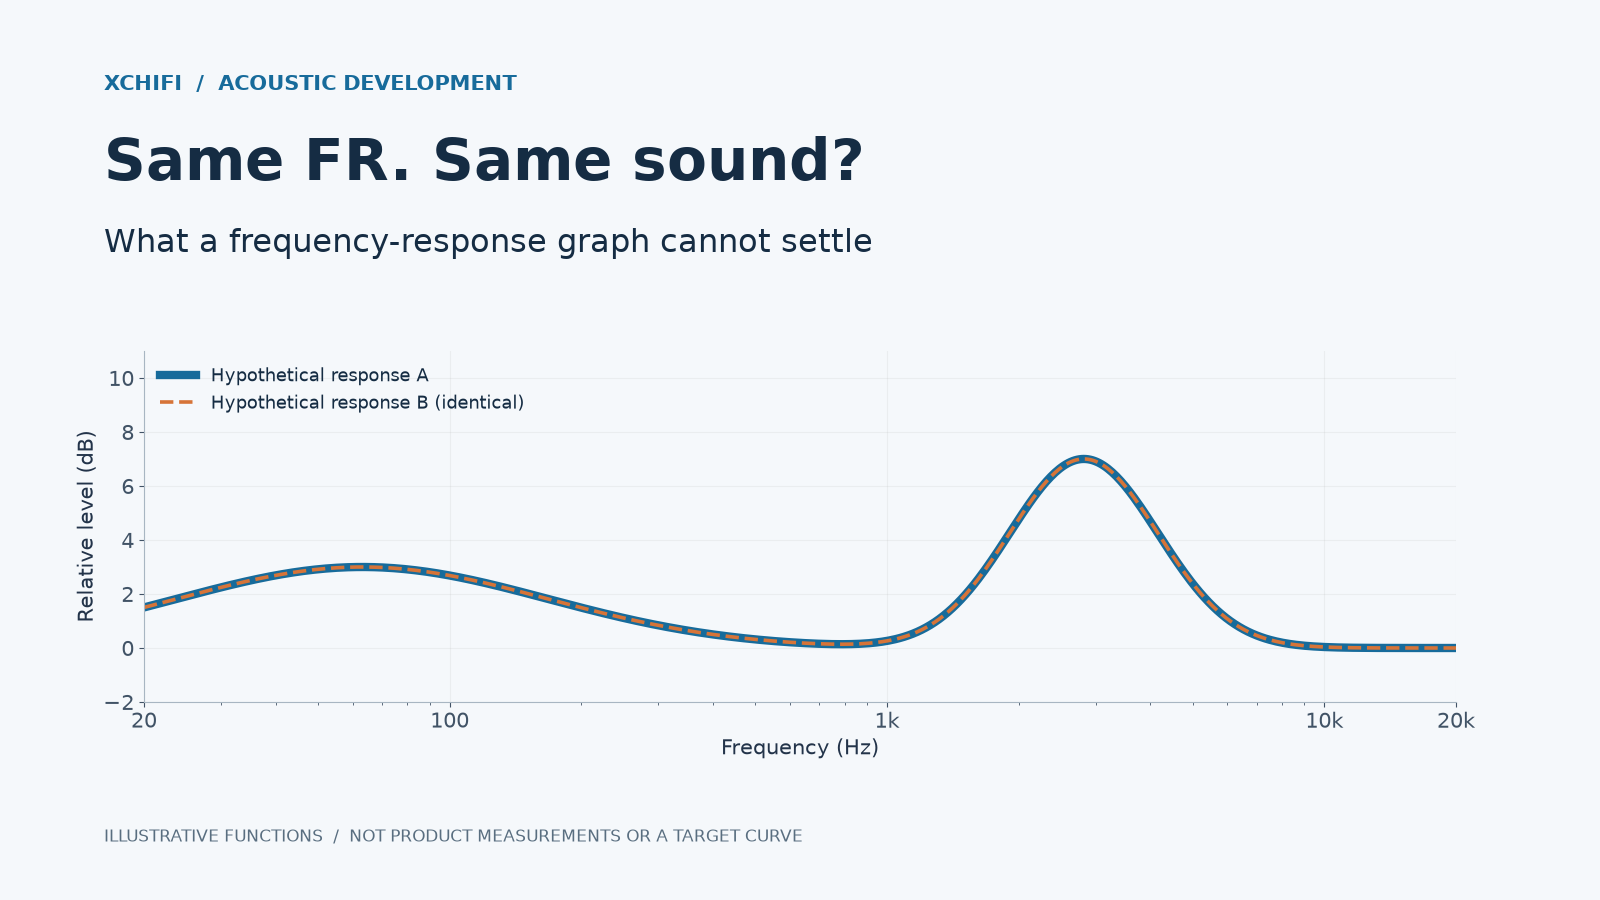
Put a US$0.30 dynamic driver and a US$3.00 driver into identical IEM housings. Adjust their tuning until the frequency-response curves overlap. Hide the prices. Which earphone would you choose?
If all you have is that graph, you cannot name a winner. You know something important about their tonal balance. You do not yet know whether they behave alike when the music gets demanding—or whether any remaining difference is audible.
This is where discussions about frequency response often go wrong. “The curves match” becomes “the sound must be identical.” The opposite claim is just as easy: “The expensive driver must have better detail.” Neither conclusion follows from the evidence.
What exactly have we matched?
A typical IEM frequency-response graph shows sound pressure level against frequency. Two overlapping traces mean the measured output at each frequency matches, within the measurement’s resolution and uncertainty. That is a meaningful result.
But it belongs to a particular setup: an ear simulator, an insertion depth, a seal and a test level. Change the fit and the response can change. Smooth the curves heavily and small peaks can disappear. Normalize them at one frequency and you can hide a sensitivity difference.
For our comparison, assume the housing geometry, tips and seal are held constant, and the magnitude FR really does match at the reference level. The prices are illustrative component costs, not quotations for products we have tested.
Even then, the housing does not erase the differences between drivers. Their suspensions, motors and vents may respond differently to the same acoustic load. If EQ is needed to match the curves, one driver may require more voltage or excursion than the other. A housing that suits one driver may also be a poor match for the other.
The same 100 Hz note can come with different baggage
Send both drivers a 100 Hz tone. Suppose each produces 94 dB SPL at 100 Hz. On the fundamental-response graph, they agree.
A nonlinear driver can also produce sounds you did not put into the signal: harmonics at 200 Hz, 300 Hz and higher. Those extra components are not fully described by the usual fundamental FR trace.
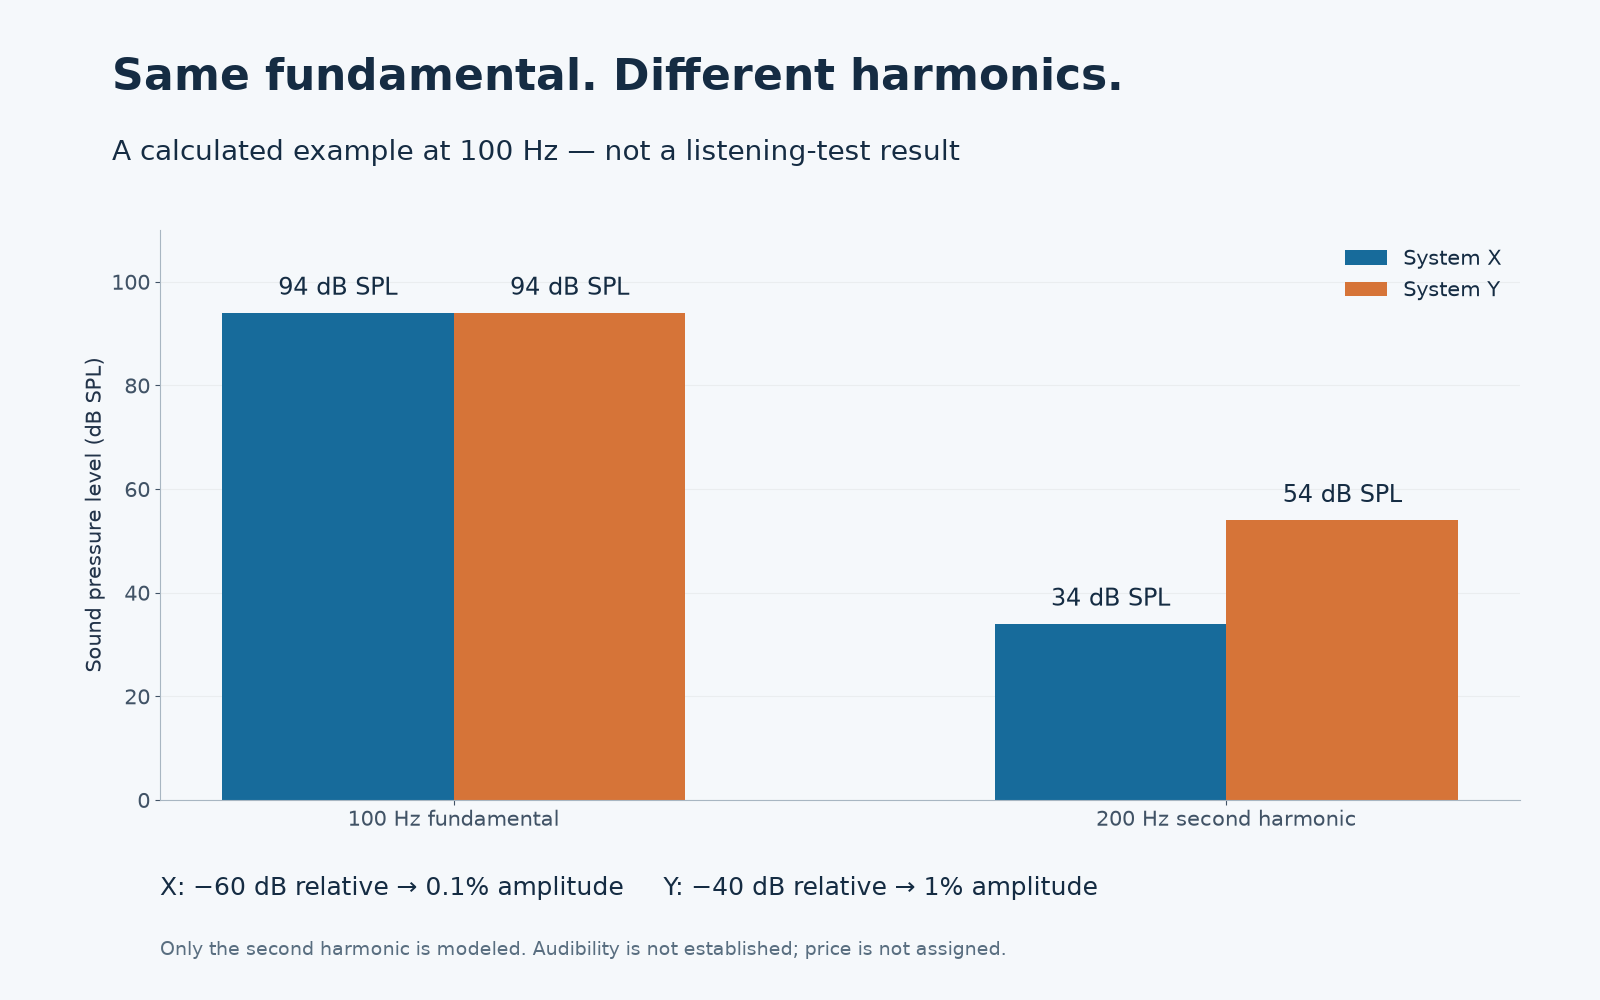
Here, X has a second harmonic 60 dB below its fundamental; Y has one 40 dB below. Those correspond to pressure-amplitude ratios of 0.1% and 1%, respectively. With no other harmonics, they would also be the THD values. The conversion is 10(relative level / 20).
The main note is equally loud. The complete output is different. That is the distinction the FR graph alone misses.
Would you hear it? These numbers alone do not settle that either. Harmonic order, frequency, playback level and masking by the music all matter. A measurable difference is not automatically an audible problem.
Turn up the input. Does the output keep up?
Now double the input voltage. A linear system should increase its sound pressure level by approximately 6.02 dB. If it produces a smaller increase, it is compressing.
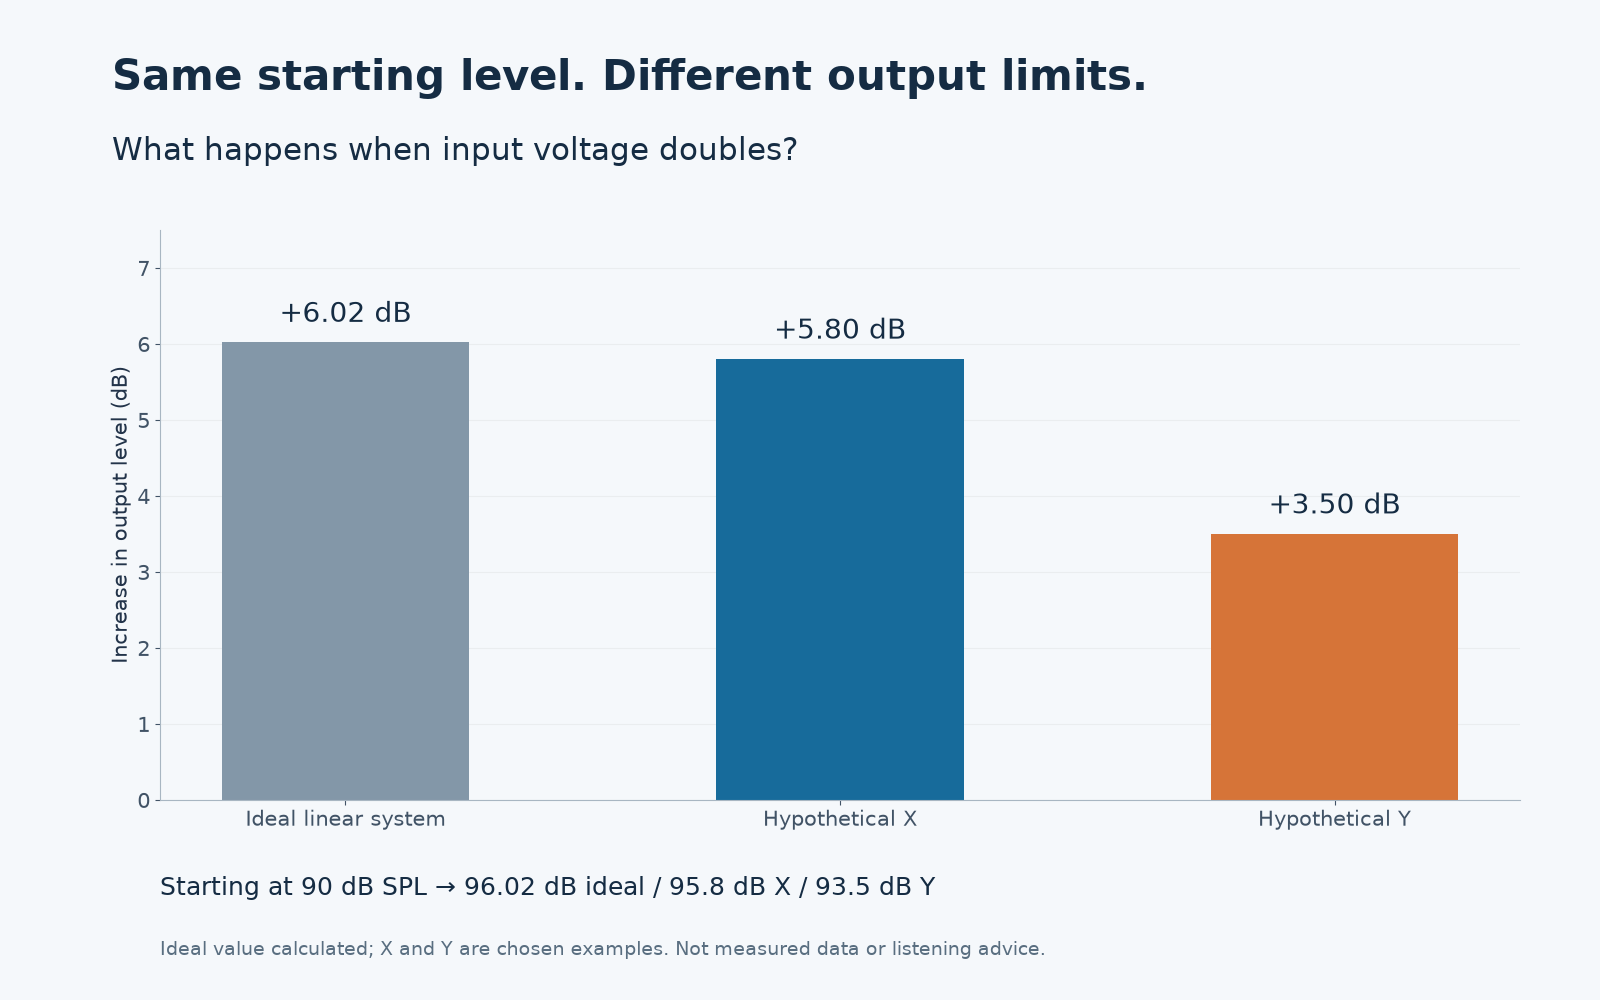
Both examples begin at 90 dB SPL. Doubling the voltage takes X to 95.8 dB and Y to 93.5 dB, rather than the ideal 96.02 dB. Their output falls short by 0.22 dB and 2.52 dB.
A single FR measurement at the starting level would not reveal that difference. During music, output limits can become relevant on bass-heavy passages or peaks. Distortion may rise as well.
Nothing in this example tells us the cheaper driver would be Y. Assigning it that role without measuring it would turn an explanation into a sales pitch.
What about “speed” and “resolution”?
A conventional FR plot mainly shows magnitude. A complete linear response also includes phase, so matching magnitude alone does not mathematically guarantee an identical waveform.
That leaves a real question to investigate, not a blank space to fill with claims about superior “speed.” Frequency response and time response are related. Where a system behaves approximately as a minimum-phase system, magnitude and phase are linked. A simple overall delay is not, by itself, worse sound in an earphone playing alone.
If someone claims two matched earphones differ in transient behavior, ask what differs, how it was established and whether it is audible. The price tag cannot answer those questions.
Where FR scores help—and where they overreach
A reviewer gives one IEM 92 points and another 85. Before treating that as a sound-quality verdict, find out what earned the points.
If the score measures distance from a target curve, it describes a tuning match under a particular formula. That can be useful. It does not establish that the higher-scoring earphone has lower distortion, greater clean output or a better fit in your ears.
| What the reviewer says | What would support it? |
|---|---|
| “It has more measured bass.” | Comparable FR measurements with appropriate level alignment. |
| “It is closer to this target.” | A stated target and scoring method. |
| “Listeners are likely to prefer it.” | A prediction method validated against listening results, within its tested scope. |
| “It stays cleaner at higher output.” | Distortion and output-level measurements. |
| “It sounds better to everyone.” | A target-match score cannot establish that. |
A simple target-distance score should not be confused with a listening-validated preference model. The latter can estimate group preferences within its limits. Neither guarantees your own preference.
There is another trap: equal scores do not even mean equal curves. One earphone might lose points for too little bass; another for a treble peak. The final numbers can match while the tonal balances do not.
The issue is not whether reviewers should use FR. They should be clear about what their score measures. Calling a target-match score a complete assessment of sound quality asks it to do a job it has not demonstrated it can do.
US$0.30 or US$3.00: which one sounds better?
We still need the missing evidence. If one earphone adds audible distortion or compresses on musical peaks while the other stays clean, that is a relevant advantage. If their actual in-ear responses are close and their remaining differences cannot be heard at the levels used, they may be difficult to distinguish.
More money could buy tighter production tolerances, greater headroom or better durability. It could also reflect smaller production runs or other manufacturing costs. Without data for these particular drivers, those are possibilities, not findings.
For a real comparison, check multiple samples, repeat the fits and measure at several output levels. Then match listening levels, conceal identities and randomize playback. Ask two separate questions: can people tell them apart, and which do they prefer? Identifying a difference does not automatically establish a winner.
The FR graph tells us the measured tonal balance matches. It does not tell us who wins. Neither does the price.
Related reading: Does a bigger IEM driver sound better? More design topics: Acoustic Development and Tech & Drivers.