
SOURCE 19 · RESPONSE & IMPEDANCE · 12 / 17
Frequency Response & Impedance Measurement
A beginner-friendly rewrite of sweep and impedance measurement: what each graph reveals and the traps in comparing IEM results.
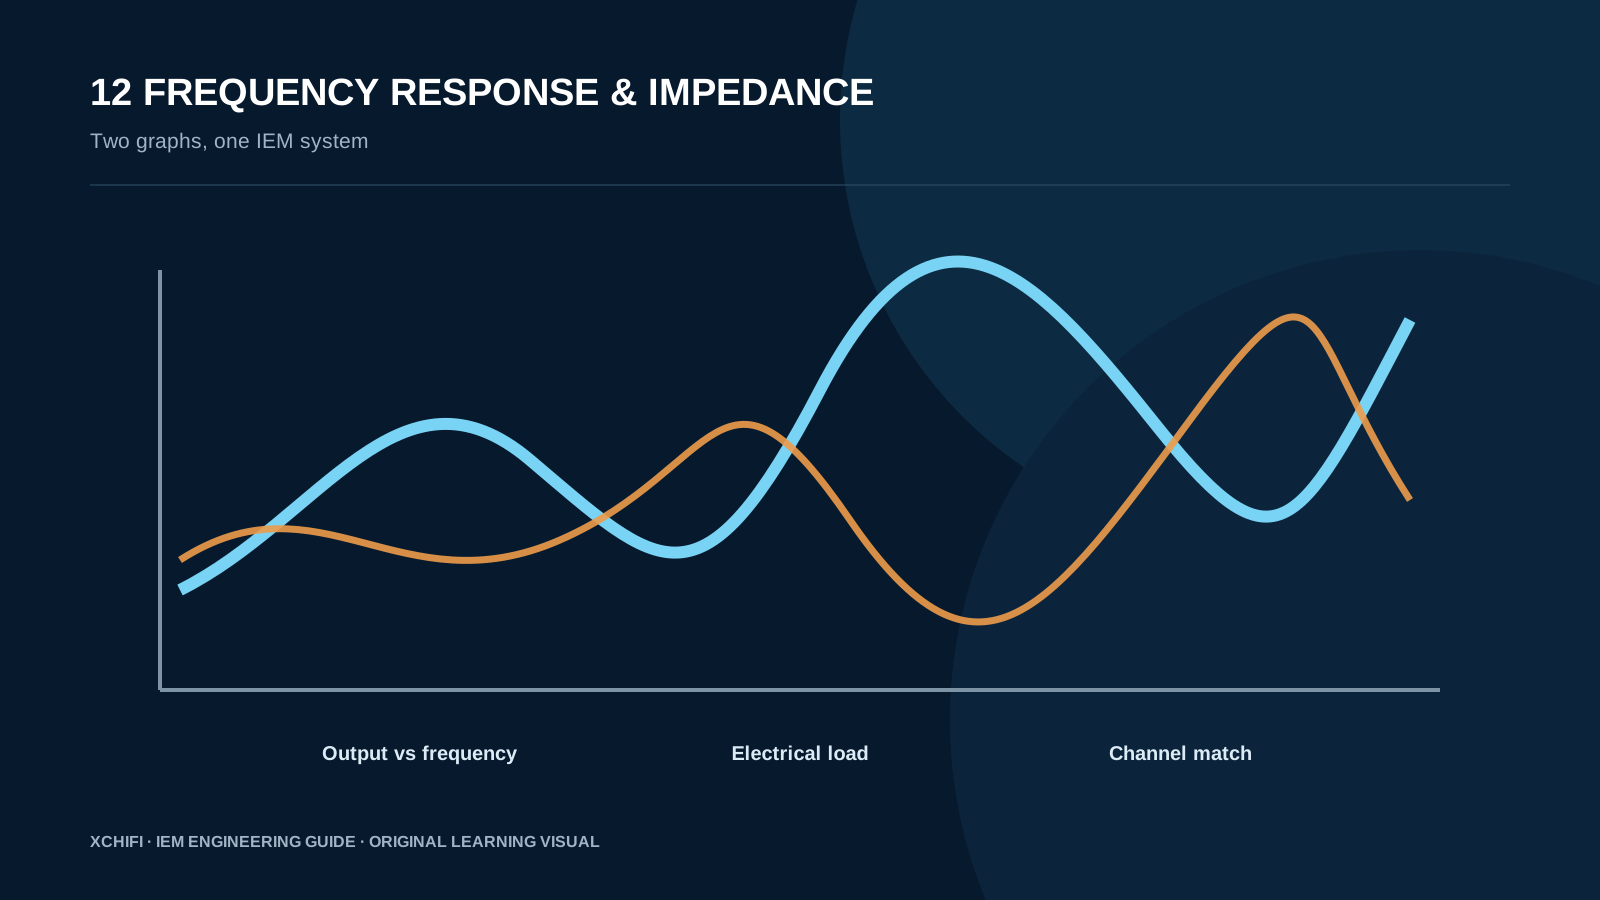
19.1 Stepped-sine and logarithmic sweeps
Read the broad bass, midrange and treble balance first. Narrow upper-frequency features are more sensitive to coupler, insertion and compensation.
19.2 MLS and noise-rejection trade-offs
Overlay left and right responses from the same rig. A close match supports stable imaging; mismatches call for checks of driver, mesh, nozzle and assembly.
19.3 Constant-voltage and constant-current impedance tests
It changes with resonance, networks and driver type. Large variation can make tonal balance more sensitive to high-output-impedance sources.
19.4 Frequency-response interpretation
The graph locates a physical difference; matched-level listening tests whether it matters for the intended music and use.
19.5 Data processing and smoothing
Compare curves made with the same rig, target, tip, insertion and smoothing whenever possible.
19.6 Data-processing and interpretation summary
Stepped sine, MLS and logarithmic sweeps each trade speed, noise rejection and interpretation. Smoothing should be disclosed rather than used to hide structure.